Cloud Native OCI
Observability & Monitoring
 +
+
Created with ❤ by Oracle A-Team
Background
Expect a fundamental culture change concerning monitoring when shifting to Cloud Native. Instead of monitoring to avoid failure, monitor to manage failures.
Observability
- Health Checks
- Metrics
- Logging
- Tracing
Each fluid entity must produce appropriate data to support problem detection
and alerting, manual debugging when necessary, and system health analysis
Telemetry
- Automated
- Centralized
- Compliance
Automatic collection and transmission of data from transient processes
to centralized locations for subsequent analysis
Monitoring
- Aggregated
- Holistic
- Visible
The state of the system is monitored as a whole. Each individual service
produces data that feeds into an aggregated view.
OCI Monitoring
 Monitoring
Reports metrics from all resources and services in Oracle Cloud Infrastructure.
- Service Metrics
- Alarms
- Health Checks
- Integrated Dashboards
- API Accessbile
DATA
 Grafana
Widely adopted open source tool for monitoring, metric analytics, dashboards sourced by its integrated extensive Data Sources and plugins
- 📈 Dashboards
- ⚠️ Alarms
- 🔔 Notifications (Slack, PagerDuty, etc...)
DATA
 Prometheus
Container metrics and alerting toolkit fitting dynamic microservice architectures
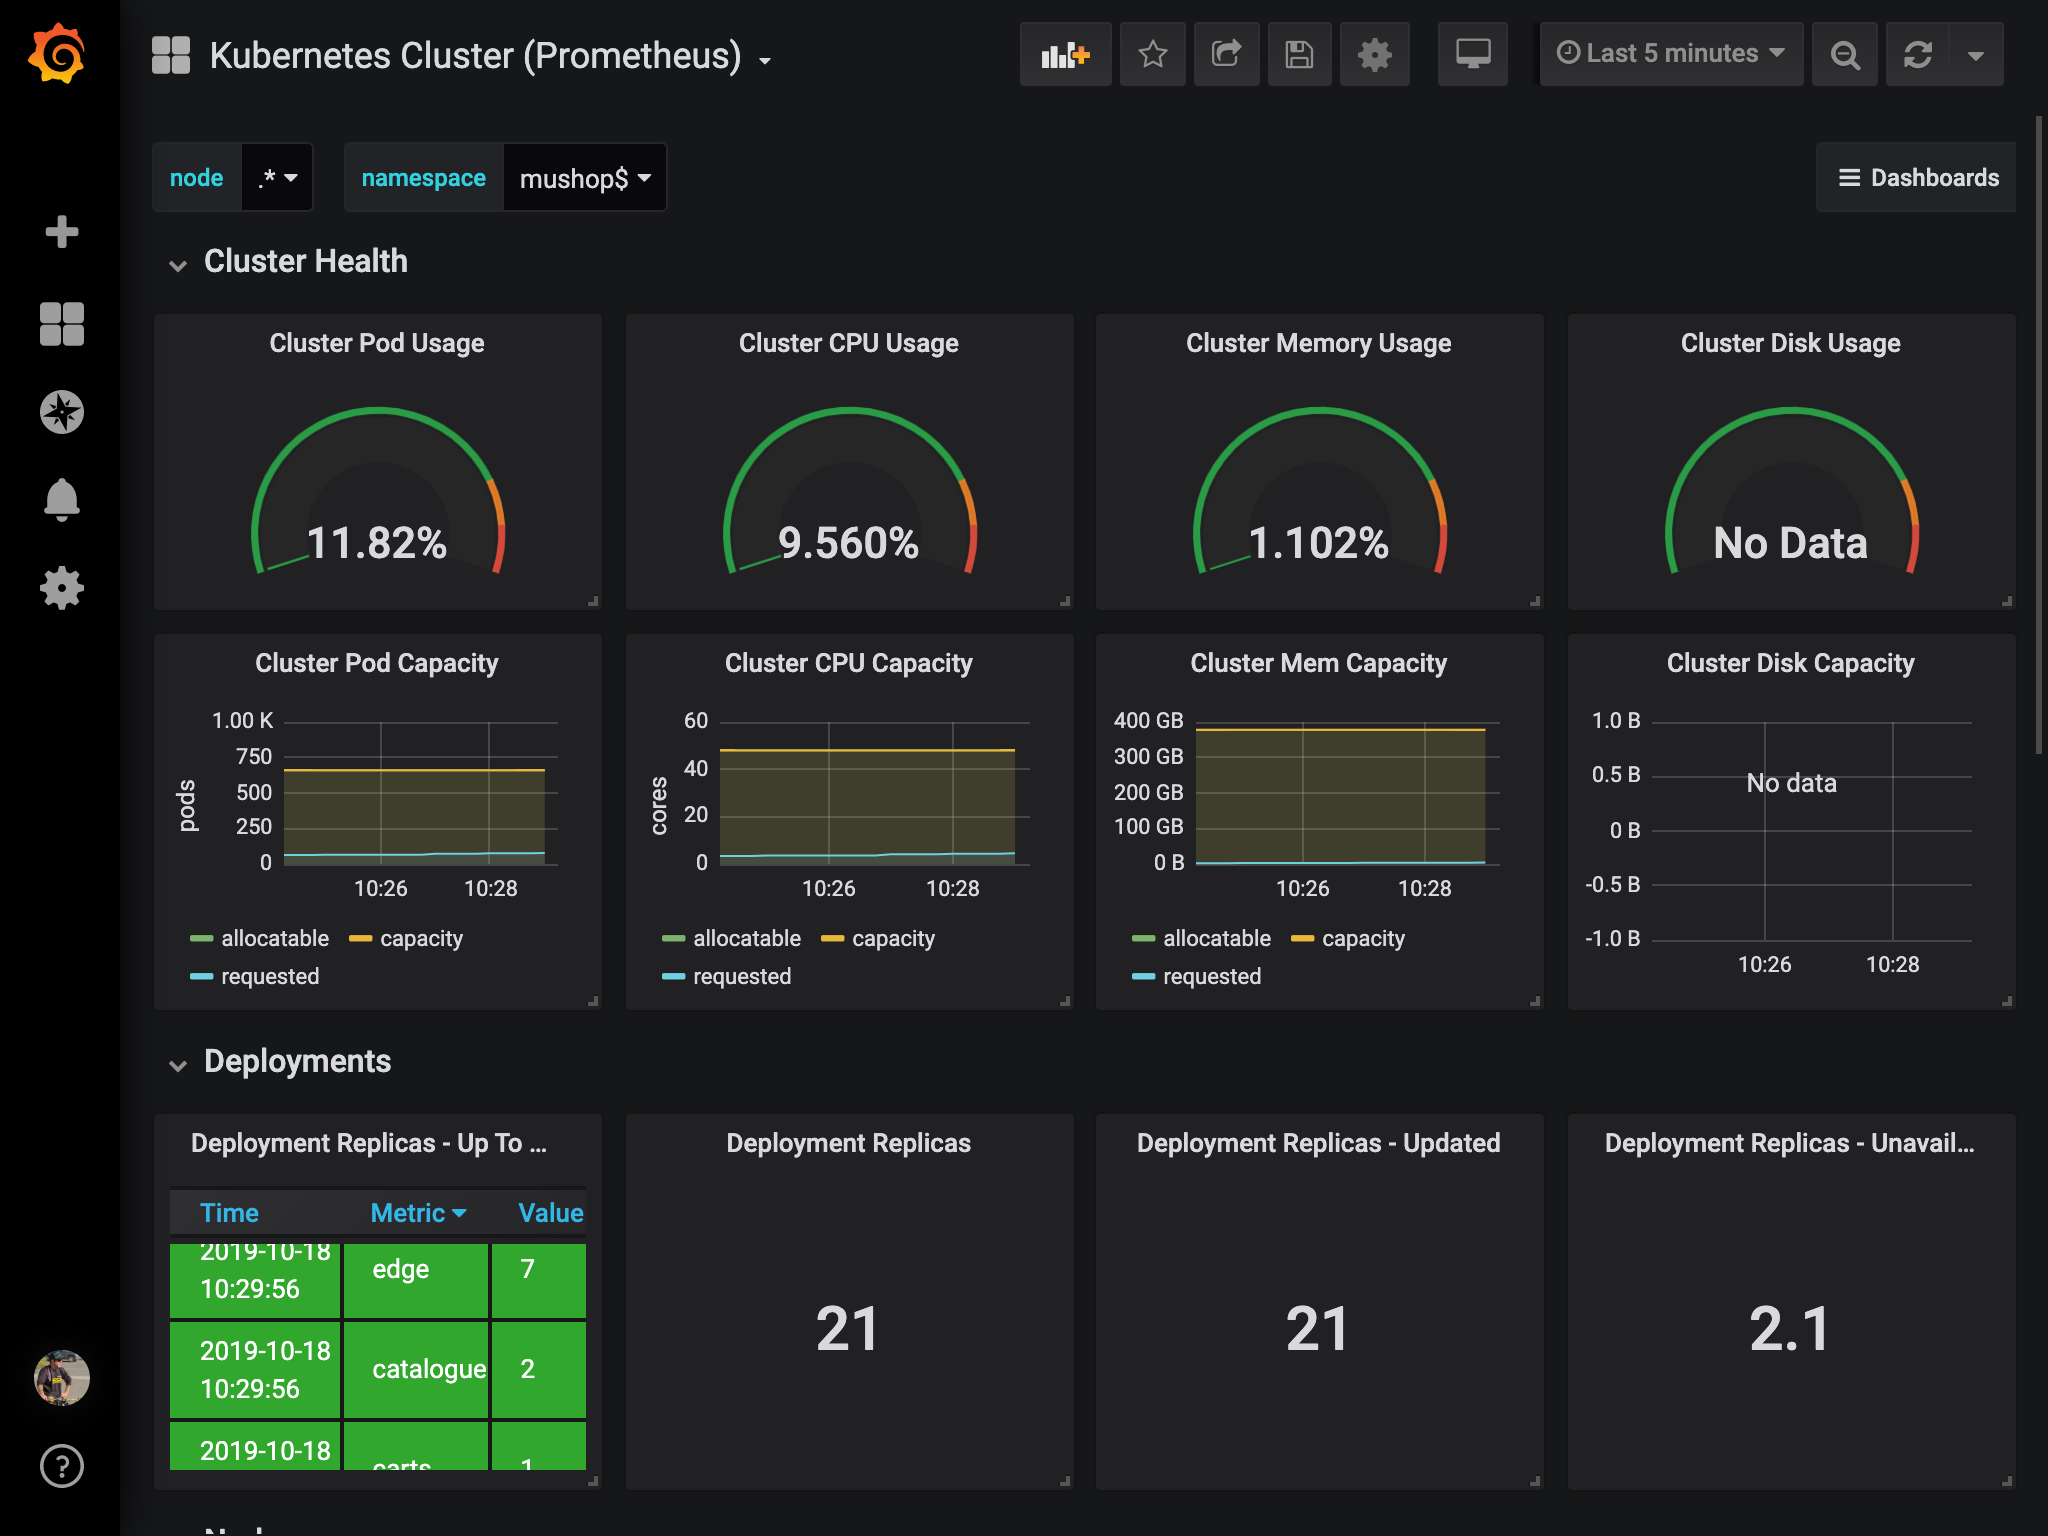
Kubernetes Cluster
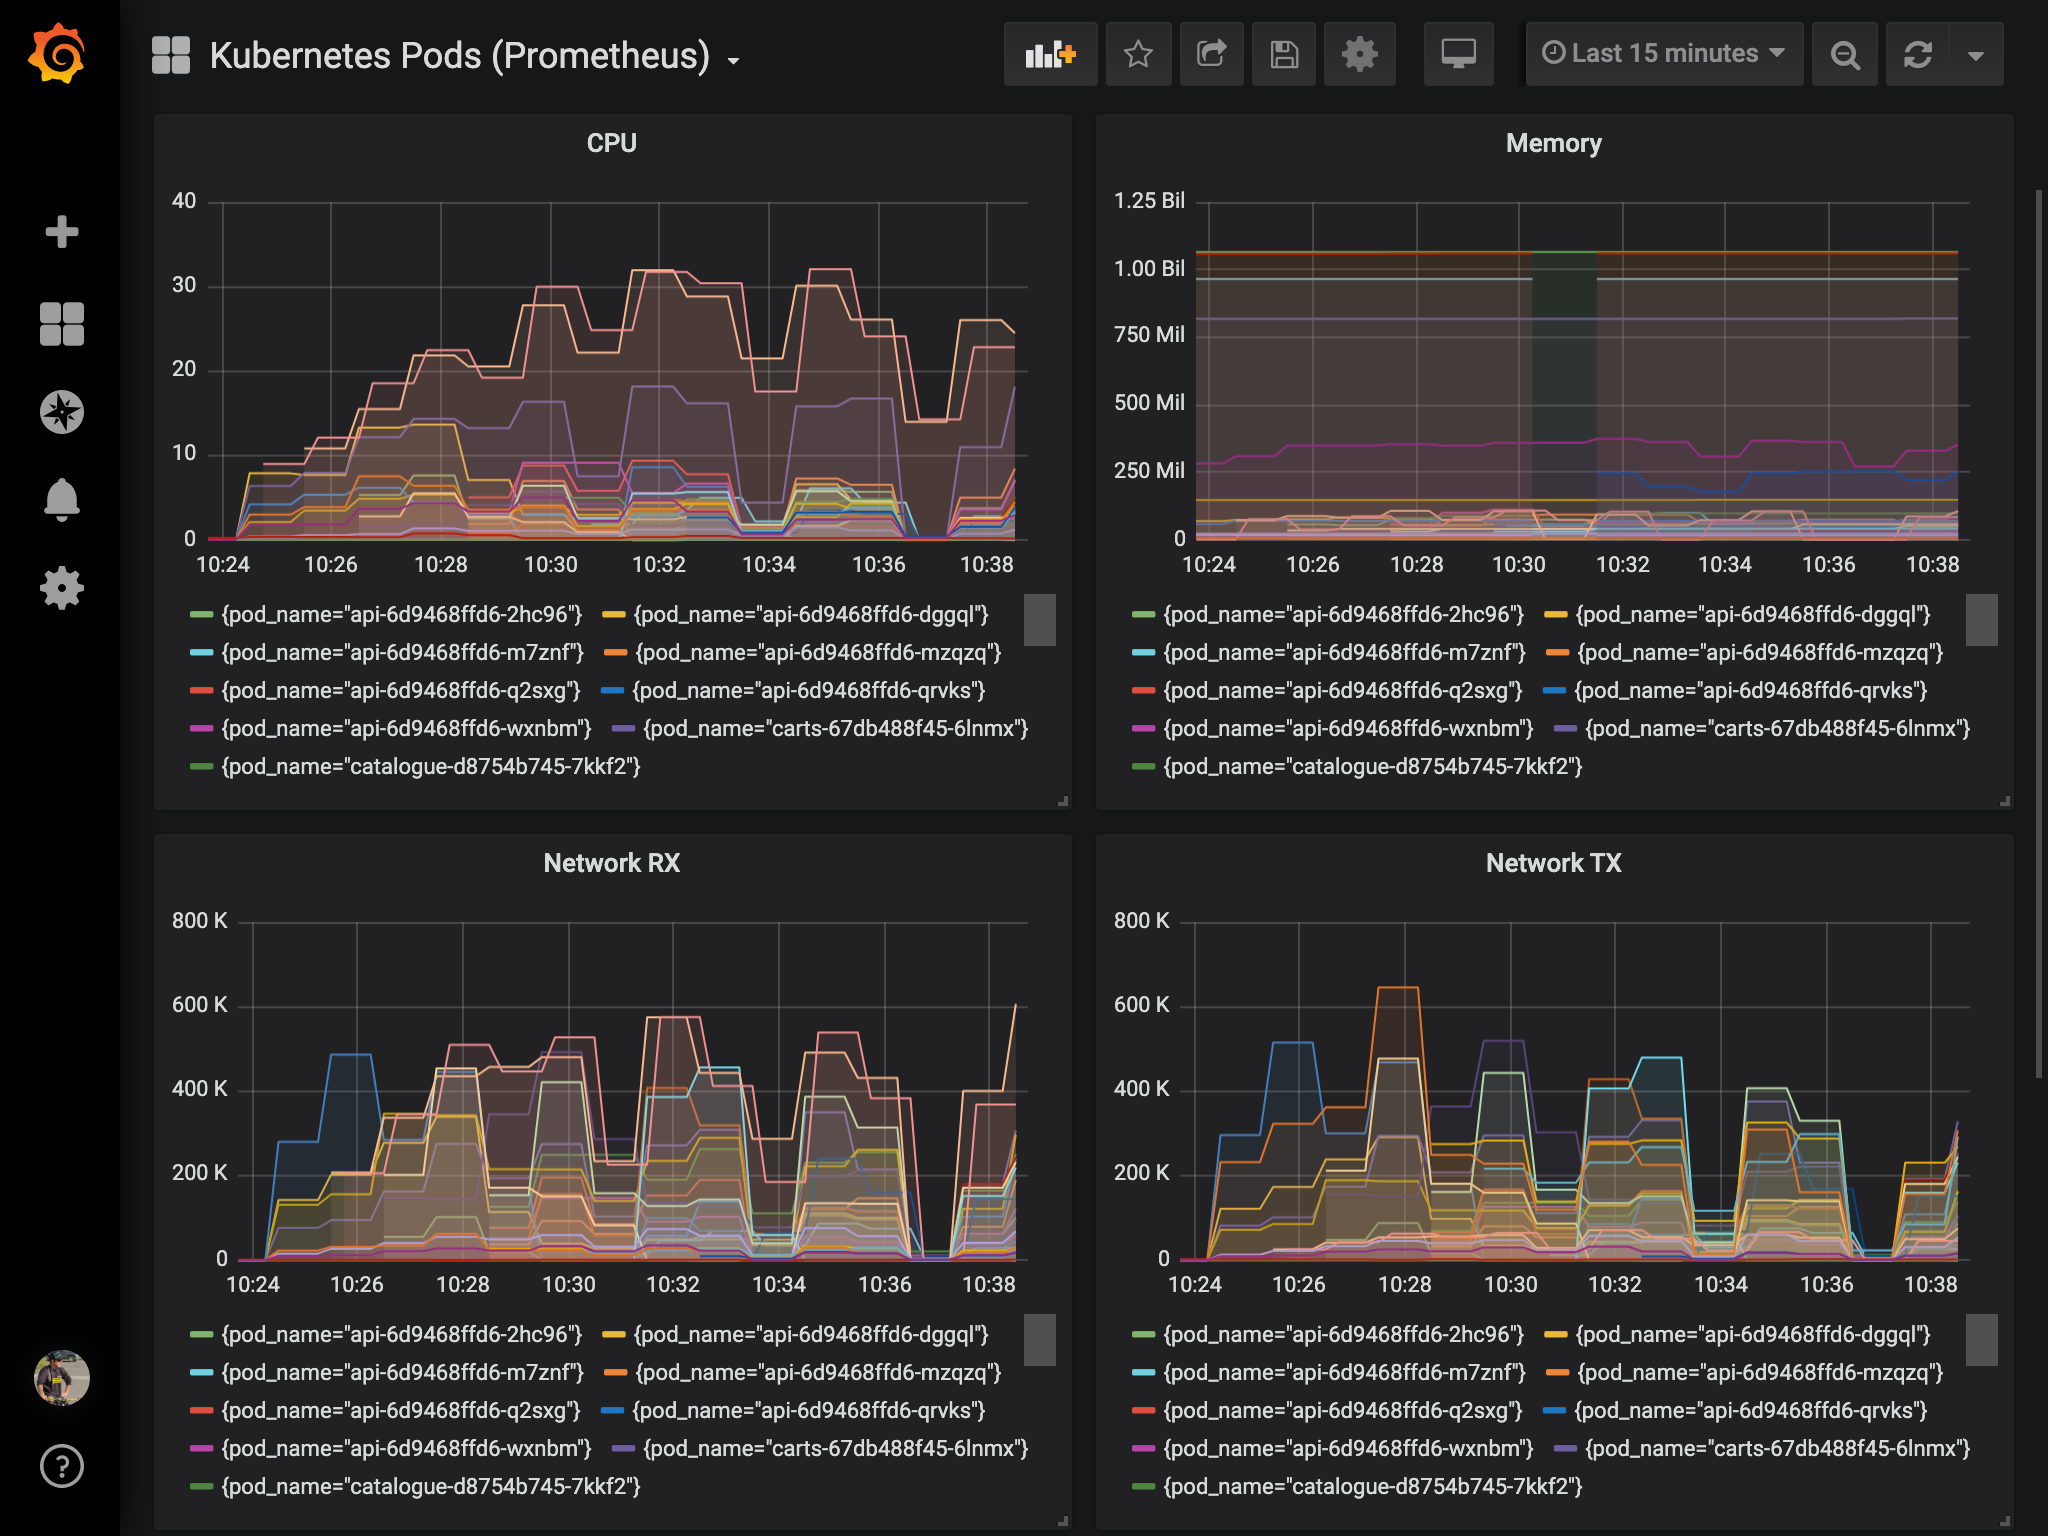
K8S Pods (MuShop)
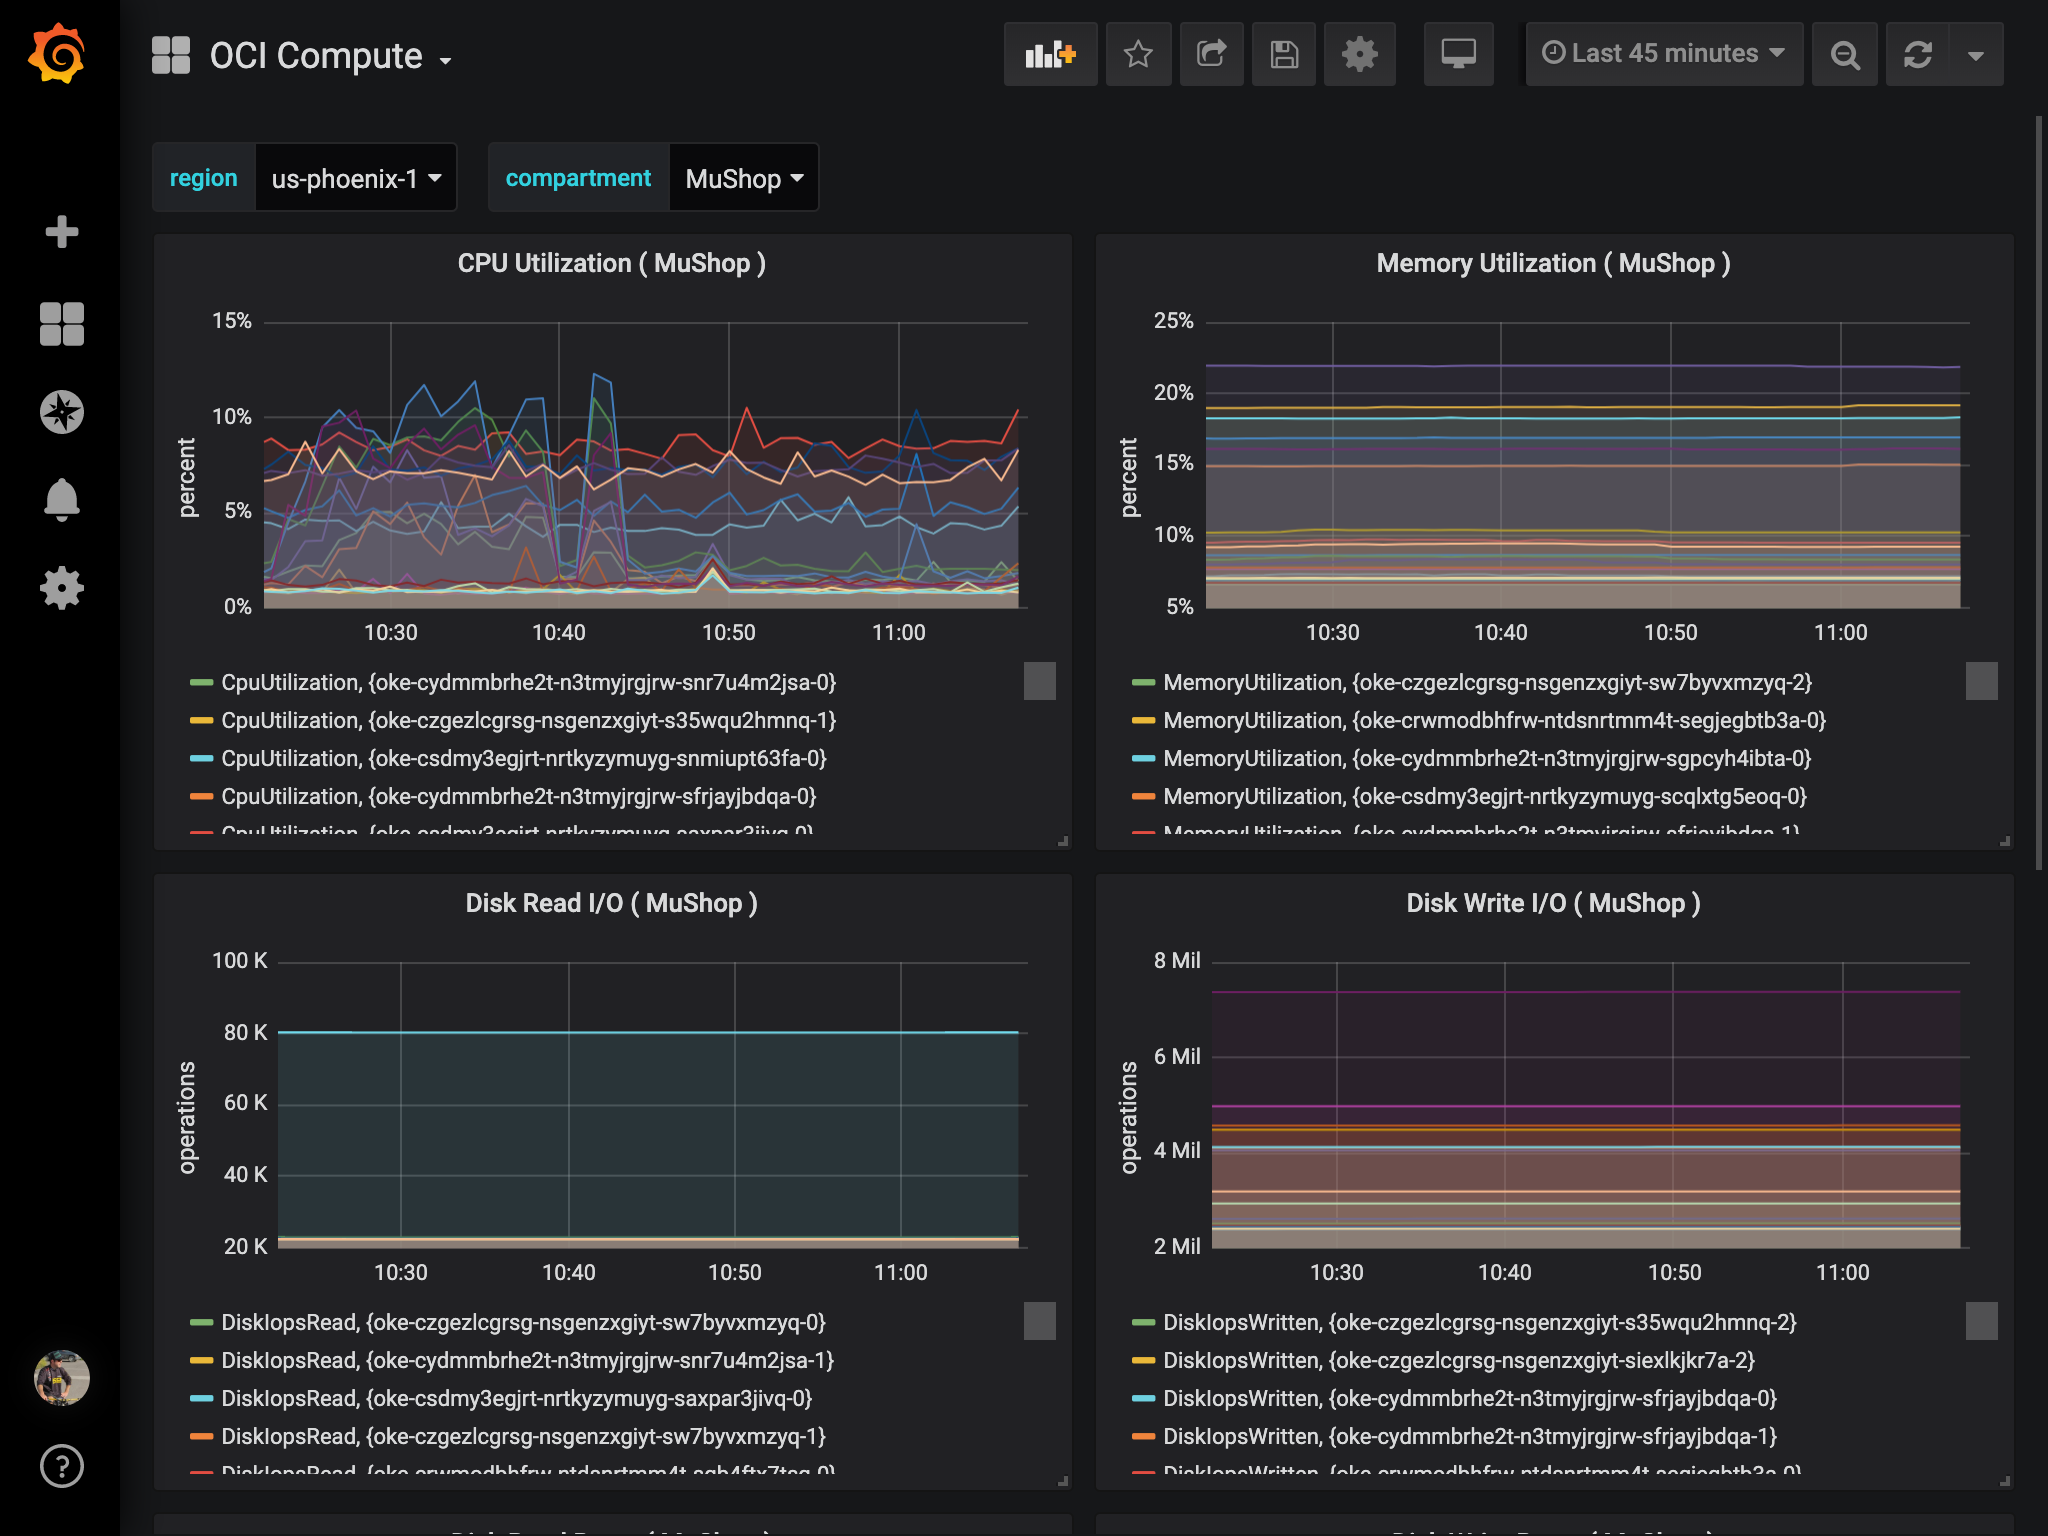
OCI Compute
Monitoring MuShop
- Access Grafana
- Check Data Source
- Import Dashboards
- 📈 Scale It
-
![grafana]() 👍 Good news! We already installed Prometheus/Grafana as part of the umbrella chart during
👍 Good news! We already installed Prometheus/Grafana as part of the umbrella chart duringsetup. Now let's revisit the charts and connect to some Grafana dashboards!helm list --all-namespaces
Get the output from the setup installation:NAME NAMESPACE REVISION UPDATED STATUS CHART APP VERSION mushop mushop 1 2020-01-31 21:14:48.511917 -0600 CST deployed mushop-0.1.0 1.0 mushop-utils mushop-utilities 1 2020-01-31 20:32:05.864769 -0600 CST deployed mushop-setup-0.0.1 1.0
Get the auto-generated admin password:helm status mushop-utils -n mushop-utilities ## Grafana...
Connect to the dashboard with admin/<password>:kubectl get secret -n mushop-utilities mushop-utils-grafana \ -o jsonpath="{.data.admin-password}" | base64 --decode ; echokubectl port-forward -n mushop-utilities \ svc/mushop-utils-grafana 3000:80 -
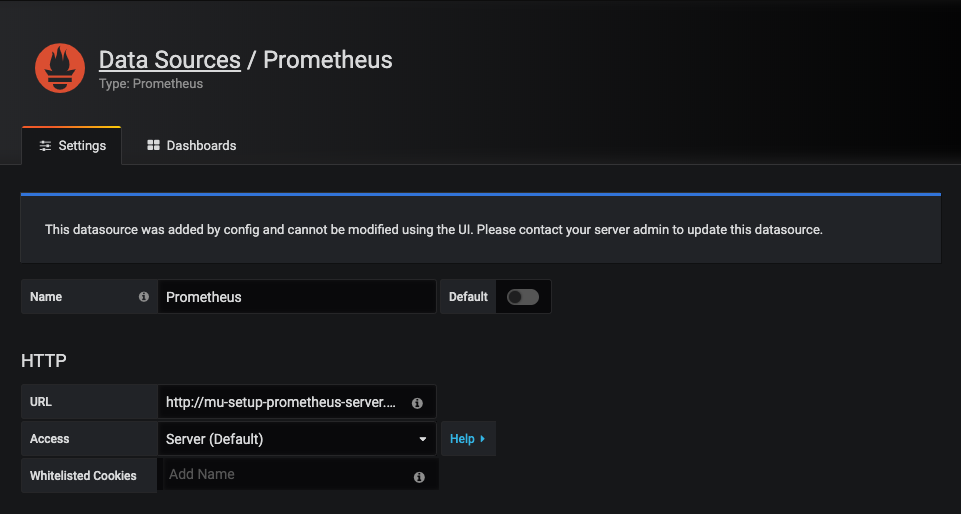
![Prometheus]() The Prometheus Data Source was also added automatically with the umbrella setup chart 💥
The Prometheus Data Source was also added automatically with the umbrella setup chart 💥Click ⚙️ Data Sources and see Prometheus
![]()
-
Grafana hosts a tremendous number of dashboards created by the user community.
This makes it very easy to import rich, freely-available dashboards.
- Navigate ➕ » Import
- Add dashboard id:
6417(Kubernetes Cluster) - Navigate ➕ » Import
- Add dashboard id:
6336(Kubernetes Pods)
![k8s cluster]()
-
Now that dashboards have been imported, let's deploy load-simulation
pods to the cluster.
ℹ️ This also showcases the Horizontal Pod Autoscaling configurations deployed with the MuShop application
Return to themushopsource code directory:
🔥 Deploy the load simulation pods:# mushop>
Watch the Horizontal Pod Autoscaling outputkubectl create -f src/load/load-dep.yaml
Now return to the Grafana console and review the dashboards...NAME REFERENCE TARGETS MINPODS MAXPODS REPLICAS AGE mushop-api Deployment/mushop-api 47%/70% 1 10 5 4m2s mushop-catalogue Deployment/mushop-catalogue 30%/70% 1 10 3 4m2s mushop-edge Deployment/mushop-edge 57%/70% 1 10 6 4m2s mushop-storefront Deployment/mushop-storefront 25%/70% 1 10 1 4m2s mushop-user Deployment/mushop-user 20%/70% 1 10 3 4m1s
🧯 Be sure to remove the load simulator when done:kubectl delete -f src/load/load-dep.yaml
More on Observability
This exersise demonstrate the applications of Prometheus and Grafana in
time-series metrics aggregation, and analysis respectively. However, by no means do
these represent the full extent of observability in Cloud Native
technologies.
Metrics
When was this method called?
Analytics
Easily stored and queried numeric representation of data
that is collected at intervals into a time series
vs
Tracing
How was this method called?
Flow
Captures the end-to-end flow of a request through the system,
and the relationships between services
vs
Logging
What happened inside this method?
Cause
Discrete events essential for debugging, which povide contextual
information helping to identify observed failures